
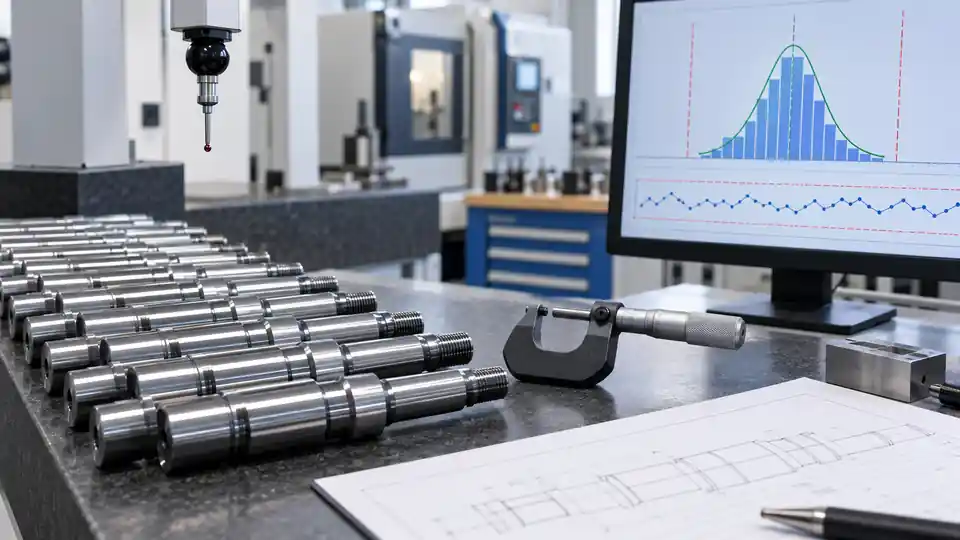
Capability indices can help a CNC buyer judge whether a repeat-production process has enough margin to a critical dimensional specification. They can also create false confidence when the data combine different machines, hide tool-wear drift, include an unsuitable measurement system, or come from a short prototype run. Cp and Cpk are summaries of a defined, stable process—not substitutes for control charts, engineering judgment, or inspection records.
This Cpk CNC machining guide explains how to plan Cp and Cpk for critical dimensions before awarding or releasing production. It covers the difference between the indices, data prerequisites, rational subgroups, measurement-system effects, one-sided limits, geometric tolerances, confidence in estimates, and a practical supplier evidence package. The objective is not to impose one universal Cpk threshold. It is to make the characteristic, process stream, sampling plan, calculation, and response rule explicit enough that a buyer and supplier reach the same conclusion.
Start With the Engineering Characteristic
A capability study is only as clear as the characteristic it measures. Identify the feature by part number, drawing revision, characteristic number, nominal value, limits, units, and finished condition. If the requirement is geometric, include its datum reference frame, material condition modifier, and evaluation rule. Avoid a spreadsheet label such as “bore 4” that cannot be traced to the controlled drawing.
Ask why the characteristic is critical. A bearing seat may control interference and running clearance. A sealing land may control compression. A hole pattern may control assembly. The functional reason informs how the feature should be measured, whether centering matters, and what should happen when the process trends toward a limit.
Specification limits must come from the released product requirement. They are not control limits and must not be calculated from production data. Control limits describe expected process behavior; specification limits describe acceptable product. Confusing the two changes the meaning of the study.
For every selected characteristic, record:
- the drawing and revision that establish the requirement;
- the operation and process stage that create the characteristic;
- the condition in which it will be measured;
- the instrument, program, fixture, and evaluation method;
- the process stream included in the study; and
- the decision that the capability result will support.
Cp and Cpk Answer Different Questions
For a two-sided specification with upper limit USL, lower limit LSL, estimated process mean x-bar, and estimated standard deviation s:
Cp = (USL − LSL) / (6s)
Cpk = minimum of [(USL − x-bar) / (3s), (x-bar − LSL) / (3s)]
Cp compares the specification width with the estimated process spread. It describes potential capability if the distribution is centered. It does not use the process mean.
Cpk includes both spread and centering. It uses the distance from the mean to the nearer specification limit. A process can therefore have a comfortable Cp but a much lower Cpk when it runs off center. Cpk should not exceed Cp under the conventional two-sided definitions when the same data and standard-deviation estimate are used.
The NIST Engineering Statistics Handbook explains these definitions and emphasizes that capability compares an in-control process with specification limits. It also notes the normal-distribution assumption behind the conventional indices and the importance of a sufficiently large data set.
What the indices do not tell you
Neither index proves that every delivered part conforms. Neither reveals when a special cause occurred, when two process streams were mixed, or when measurement error dominates the observed spread. A single Cpk value also hides the time order of the data. Always review a run chart or suitable control chart, the distribution, individual results, and the study definition alongside the index.
An index does not convert an engineering tolerance into an acceptable scrap probability without assumptions. A numerical estimate based on nonnormal, autocorrelated, unstable, censored, rounded, or selectively sampled data may not support the familiar interpretation.
Demonstrate Stability Before Claiming Capability
Capability is intended to describe common-cause variation from a stable process. If the mean drifts with tool wear, a fixture moves, a probe tip is changed, or a new material heat behaves differently, one pooled standard deviation can blur those changes into an unhelpful average.
Plot results in production order. Mark events such as tool changes, offsets, insert indexing, setup changes, material lots, operators, warm-up, maintenance, and remeasurement. Select a control chart that matches the data and subgroup structure. Investigate out-of-control signals before calculating or accepting capability.
Do not remove an inconvenient point merely to improve Cpk. Exclusion requires a documented assignable cause, containment of potentially affected product, and a rule established before the final calculation. If the cause remains part of normal production, its variation belongs in a performance assessment or requires process improvement.
The NIST process-stability guidance states the sequence plainly: stability must be demonstrated before capability is discussed. For CNC production, that means the study window should be long enough to encounter the sources of variation the claimed process actually experiences.
Define the Process Stream Precisely
“This part has Cpk 1.67” is incomplete. Capability belongs to a specified process stream. One machine, fixture, spindle, cavity, program revision, material family, and measurement method may behave differently from another.
Define whether the study covers:
- one machine or a pool of machines;
- one fixture station or every station;
- one spindle, turret, or pallet position;
- one program and offset strategy;
- one cutting-tool family and change rule;
- one raw-material grade, form, temper, and supplier route;
- one shift or normal production across shifts;
- one inspection method and program revision; and
- one site or several sites.
If production will be sourced from three machines but the study uses only the best machine, the result does not establish capability for the awarded route. Either qualify each stream separately or design a study that intentionally represents the pooled stream and analyze between-stream effects. Pooled data can be commercially useful, but it answers a different question from within-machine capability.
Use Rational Subgroups to Expose Meaningful Variation
A rational subgroup groups observations made under conditions expected to share only short-term, common-cause variation. Differences between subgroups then help reveal time-related change. The subgroup must reflect the process, not the convenience of a spreadsheet template.
For a machining operation, a subgroup might contain consecutive parts produced with the same setup over a short interval. Subgroups could be collected at startup and at planned intervals through a tool-life cycle. That design allows within-subgroup variation to be distinguished from drift between subgroups.
Do not place one part from each of several machines into a subgroup unless the study is intentionally designed to treat those machines as one process. Do not sort values from low to high or group them after seeing the results. Preserve production order and record the sampling rule before collection.
Individual measurements versus subgrouped data
Low-volume machining may not provide natural groups of several consecutive parts. An individuals and moving-range approach may be more appropriate, but consecutive measurements still need a meaningful time basis. The selected standard-deviation estimate should be named because within-subgroup, overall, and robust estimates produce different indices.
When a report states both short-term capability and overall performance, label them clearly. Many software packages use different symbols or default estimators. The buyer should not infer equivalence from similar-looking output.
Plan a Data Window That Represents Production
No universal sample size fits every capability decision. More measurements reduce statistical uncertainty, but a large sample collected in one hour may still miss material, setup, shift, and tool-life variation. Representativeness matters as much as count.
NIST describes about 50 independent observations as a commonly considered minimum for conventional estimates, while other study objectives and customer requirements may demand more. Treat that as context, not a contractual rule. Agree the required confidence, duration, subgroups, and sources of variation for the actual decision.
A production-capability plan might deliberately span:
- more than one setup or production day;
- the expected tool-life cycle, including the change point;
- relevant raw-material heats or lots;
- normal operators and shifts;
- machine warm-up and steady-state operation; and
- the approved inspection frequency and environment.
Prototype parts made slowly with extra attention are useful for process development. They should not be labeled long-term production capability unless their route and variation represent production. An initial study can instead be reported honestly as preliminary capability, with a defined plan to update it after stable production data accumulate.
Validate the Measurement Process First
Observed variation combines manufacturing variation and measurement variation. If a bore tolerance is narrow relative to repeatability, resolution, temperature effects, alignment, fixture deformation, or algorithm choices, the estimated standard deviation may describe the inspection system as much as the cutting process.
Before the capability run, verify that the measurement process is suitable for the characteristic and range. Review calibration status, resolution, bias where relevant, repeatability, reproducibility, stability, fixture, temperature, cleanliness, and software settings. For a CMM feature, retain the alignment, datum construction, point strategy, fitting algorithm, filtering, probe qualification, and program revision.
A generic gage R&R percentage is not automatically transferable. The study should represent the parts, tolerance, operators, method, and variation range used for capability. When destructive or specialized measurement prevents a conventional crossed study, document the alternative evidence and its limitations.
The ISO 22514-7:2021 overview addresses capability of measurement processes. Use the contractually applicable standard and edition rather than copying an acceptance threshold from an unrelated program.
Control Temperature and Part Condition
Dimensional capability can change when measurement conditions are inconsistent. Metal parts, fixtures, masters, and measuring machines respond to temperature. Freshly machined parts may be warm. A thin wall may relax after unclamping. A plated, anodized, heat-treated, or assembled feature may differ from its pre-process state.
State whether the requirement applies free-state or restrained, before or after finishing, and at what reference condition. Define stabilization time and temperature monitoring where they materially affect the result. Use a handling and cleaning method that does not change the measured surface.
For a bore honed to final size, capability on the pre-hone machining operation does not prove final capability. For a bearing seat coated after machining, clarify whether the drawing dimension applies before or after coating and use the corresponding data. The report should not pool unlike product states.
Handle One-Sided Specifications Correctly
Some characteristics have only an upper or lower engineering limit: maximum flatness, minimum wall thickness, maximum surface roughness, or minimum pullout force. Conventional two-sided Cp is not meaningful when there is no opposite specification limit.
Use the appropriate one-sided index, such as Cpu or Cpl, and identify the direction. Do not invent a second limit or use zero as an implied lower limit unless the released specification actually does so. Examine the distribution and physical boundary; maximum-only geometric error values are often nonnegative and may be strongly nonnormal.
Centering also has a different meaning for unilateral characteristics. Driving a flatness value toward the midpoint between zero and the maximum is not an engineering objective. The desirable direction may be toward the natural boundary, subject to measurement resolution and process economics.
Treat Geometric Tolerances With Care
Position, profile, flatness, runout, and other geometric results do not always behave like a normal two-sided linear-size distribution. A position error reported as a diametrical value cannot be negative. Bonus tolerance at MMC or LMC changes the permitted limit with actual feature size. Profile evaluation may combine many points into a maximum result.
Before calculating a capability index for a geometric characteristic, specify exactly which result is analyzed and how the varying tolerance zone is handled. Options may include analyzing the reported geometric error against a fixed RFS limit, calculating margin to the applicable dynamic limit, or studying related coordinate components separately. Each approach answers a different question.
ISO/TR 22514-9:2023 specifically addresses capability statistics for characteristics defined by geometrical specifications. Its existence is a useful warning against treating every GD&T output as an ordinary bilateral dimension. Obtain and follow the governing method when the contract requires it.
Check Distribution Shape and Dependence
Conventional Cp and Cpk interpretation assumes a normal distribution and suitably independent observations. CNC data can violate those assumptions. Tool wear can produce a trend; automatic offsets create cycles; rounding produces discrete values; multiple fixtures form a mixture; and a hard physical boundary skews the distribution.
Review a histogram, probability plot, time plot, and stratification by relevant sources. Do not select a nonnormal distribution solely because it gives a higher index. The model should have a physical or statistical rationale and should be recorded with the method used to estimate tail performance.
Transformations, percentile methods, and nonnormal capability models may be legitimate. They must be agreed and reproducible. When data are unstable, the first action is not to find a distribution that fits the pooled result; it is to understand and control the time-related variation.
Autocorrelation can make the effective information content smaller than the raw count suggests. Consecutive measurements influenced by the same offset or thermal state are not necessarily independent. The analysis plan should address this rather than claiming unjustified precision.
Report Uncertainty in the Capability Estimate
An estimated Cpk is not the exact capability of the process. It changes from sample to sample. Small data sets can produce wide confidence intervals, particularly when the mean lies near a limit or the standard deviation is uncertain.
Report the point estimate together with sample count, subgroup structure, standard-deviation method, and an appropriate confidence bound when the acceptance decision depends on a threshold. A customer may require the lower confidence bound to exceed a criterion instead of accepting the point estimate alone. The required confidence method should be agreed before the data are reviewed.
Avoid false precision. Reporting Cpk as 1.6734 does not make the study more certain. Retain enough digits for calculation and present a sensible number for the decision.
Set Acceptance Criteria From Risk and Contract
Values such as 1.00, 1.33, 1.67, and 2.00 appear in many quality systems, but none is a universal law for every feature and production stage. The applicable drawing, purchase order, quality agreement, or customer-specific requirement controls. Product consequence, detection, sample duration, process maturity, and the cost of failure should influence the plan.
Define in advance:
- the required statistic and threshold;
- whether a point estimate or confidence bound is used;
- the minimum data quantity and duration;
- stability and distribution prerequisites;
- treatment of multiple process streams;
- allowed exclusions and approvals;
- response when Cp passes but Cpk fails;
- response when stability fails; and
- containment, correction, and resubmission rules.
If the process is stable but off center, centering may improve Cpk without changing spread. If spread is too wide, an offset alone will not create robust capability. If instability is present, contain product and investigate the special cause before relying on either value.
Cp and Cpk Planning Table for CNC Buyers
| Planning item | Question to settle | Evidence to retain |
|---|---|---|
| Characteristic | What exact drawing feature and revision are studied? | Balloon number, nominal, limits, units, GD&T definition |
| Function | What assembly or performance risk does it control? | Engineering rationale and criticality |
| Process stream | Which machine, fixture, program, tool route, and material are included? | Route and stream identifiers |
| Product state | Is measurement pre-finish, final, free-state, or restrained? | Inspection instruction and condition |
| Measurement | Can the method resolve the decision reliably? | Calibration, MSA, fixture, program, environment |
| Sampling | How many observations, subgroups, and production intervals? | Predetermined collection plan |
| Stability | Are special causes absent over the study window? | Time-order plot and control-chart review |
| Distribution | Is the selected model defensible? | Histogram, probability assessment, chosen method |
| Calculation | Which sigma estimate and index definitions are used? | Software/version or transparent calculation |
| Acceptance | What threshold and confidence rule apply? | Drawing, PO, quality agreement, approval |
| Reaction | What happens after instability or a failed index? | Containment and corrective-action record |
| Continuation | How will capability be monitored after approval? | Control plan, frequency, trigger, revalidation rule |
Example: Bearing-Seat Diameter
Consider a shaft bearing seat with a bilateral size tolerance. The example is illustrative; it is not a QuickCNCs production claim and does not establish a threshold for another drawing.
The supplier machines the seat on one lathe with a defined finish tool and measures it after thermal stabilization using a qualified comparator. Five consecutive parts form a subgroup at planned intervals across the tool-life cycle. Results are kept in production order, with material lot, offset, and insert change recorded.
The control chart shows a gradual approach toward the upper specification limit before the planned tool change. Even if pooled Cpk appears acceptable, the trend requires review because the process is not behaving as a constant stable distribution. The supplier can shorten the tool-change interval, change the compensation rule, or otherwise stabilize the route, then collect a new representative study.
If Cp is substantially greater than Cpk after stability is established, centering is the main opportunity. If both are low and similar, spread is the main problem. If a measurement study shows excessive variation, improve the measurement process before attributing the entire spread to machining.
Review the Supplier’s Calculation
Ask for data, not only a screenshot containing a green capability label. A reviewable package should include:
- part, revision, feature, specification, and units;
- raw measurements in production order;
- timestamps or subgroup sequence;
- machine, fixture, tool, program, material lot, and operator identifiers as relevant;
- measurement instrument, calibration status, method, and MSA reference;
- chart type, subgroup definition, and stability review;
- distribution assessment and any transformation;
- formulas or software settings, including sigma estimate;
- Cp, Cpk, one-sided indices, and confidence information as applicable;
- excluded observations with documented causes and approvals;
- interpretation, containment, and corrective action; and
- continuing-control or revalidation plan.
Recalculate a sample or import the raw data into an independent tool when the characteristic is important. Confirm that specification limits were entered correctly, units were not mixed, and values were not rounded before analysis. Compare the number of records with the declared sample and look for duplicated rows or suspicious sorting.
Link Capability to the Control Plan
A successful initial study is a beginning, not a lifetime approval. The control plan should state the measurement frequency, method, control chart or other monitoring rule, reaction plan, record retention, and responsibility. It should also define when capability must be re-established.
Revalidation triggers may include:
- drawing or tolerance changes;
- a new machine, spindle, fixture, or manufacturing site;
- program, tool, or cutting-strategy changes that affect the feature;
- material grade, condition, or source changes;
- measurement method or CMM program changes;
- significant maintenance or process interruption;
- recurring out-of-control signals or nonconformance; and
- restart after a long gap when the evidence no longer represents current production.
Not every administrative revision requires a new study. Use change assessment to decide whether the process definition, measurement, or functional characteristic changed. Record that decision.
Frequent Failure Modes
Capability calculated before stability
A pooled index summarizes drift, shifts, and special causes as though they formed one repeatable distribution. Inspect time order and stabilize first.
Prototype data labeled as production evidence
Slow, closely supervised parts may omit production variation. Label the result preliminary and plan a production study.
Mixed machines hidden in one column
The overall distribution may be wide or multimodal, while individual machines have different centers. Stratify and qualify the intended sourcing route.
Measurement error ignored
A marginal index may be driven by fixture, temperature, resolution, or CMM strategy. Validate the measurement task under actual conditions.
One-sided data forced into bilateral formulas
An invented limit creates a misleading Cp. Use the correct one-sided method and inspect the bounded distribution.
Values sorted before plotting
Sorting removes the production sequence that exposes drift and special causes. Preserve acquisition order.
A target is treated as a specification
Targets guide centering; specifications determine conformity. Do not create an unapproved limit from a target value.
The index is accepted without raw data
A screenshot cannot show duplicated points, removed observations, grouping errors, or wrong units. Require traceable underlying results.
RFQ Checklist
Before requesting a capability commitment, send the supplier:
- controlled 3D model and 2D drawing;
- identified critical characteristics and their functional purpose;
- specification limits, units, datum scheme, and material-condition rules;
- annual and lot quantities and expected production cadence;
- proposed machine/process pooling expectations;
- final measurement condition and any temperature requirement;
- customer-required capability method, threshold, and confidence rule;
- data and format requirements;
- initial-study timing and production-validation milestone; and
- reaction, containment, and change-notification expectations.
Ask the supplier to return assumptions and exceptions with the quotation. A commitment to “Cpk 1.33” is not comparable unless every bidder is using the same feature definition, process stream, measurement state, sampling window, and calculation method.
Make the Release Decision Reproducible
A defensible Cp/Cpk decision connects the product requirement to a stable, defined machining process and a validated measurement task. Review the time-ordered data before the summary statistic. Confirm that the study represents the machines, fixtures, tools, material, operators, and production duration included in the commercial plan. Then evaluate the appropriate index, its uncertainty, and the agreed threshold.
For quotation or production review, send QuickCNCs the controlled model and drawing, highlighted critical characteristics, expected quantities, and applicable capability requirements. We can review machining and inspection assumptions before a study plan is finalized. Capability acceptance remains governed by the released specification, purchase order, and agreed quality plan—not by a generic index value.
Use CNC tolerances and inspection to align the measurement state, review the broader controls on the quality assurance page, and submit the controlled capability requirement through Request a Quote.