
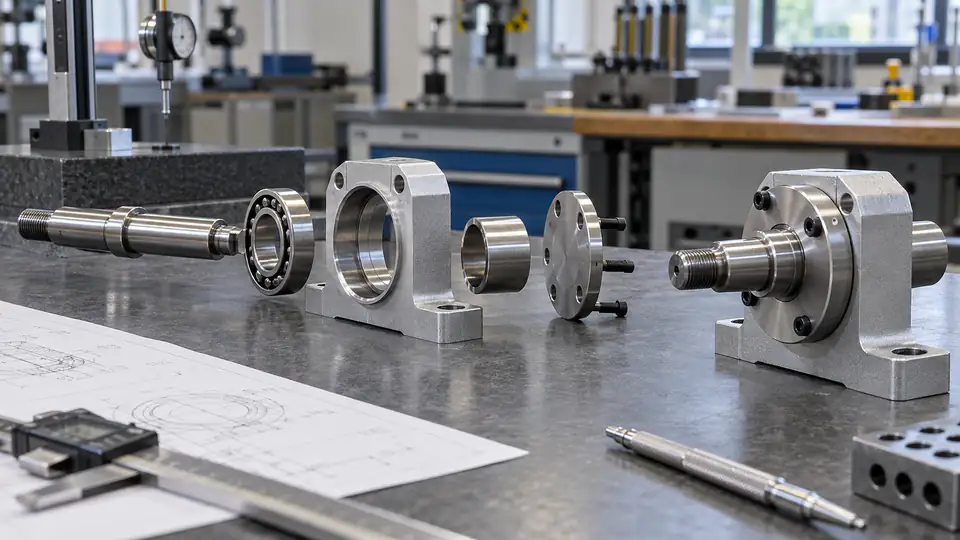
An assembly can fail even when every machined component passes its own drawing. The problem is often the accumulated variation between locating faces, hole patterns, bearings, seals, fasteners, shims, coatings, and purchased hardware. A useful tolerance stack translates those individual variations into the clearance, preload, alignment, or position that the assembly actually needs.
This CNC assembly tolerance stack guide shows how to define the closing requirement, build a dimension loop, select worst-case or statistical analysis, include GD&T and process effects, and turn the result into drawings and supplier controls. The objective is not tighter tolerances everywhere. It is a defensible allocation that protects function and can be manufactured and inspected.
Define the Assembly Response Before Building a Stack
Start with one measurable output. Examples include axial endplay, bearing preload, gear backlash, seal compression, connector location, optical spacing, piston-to-cover clearance, shaft alignment, or the remaining gap after two housings are fastened. Avoid a vague objective such as “make the assembly fit.”
Specify the acceptable range and the operating state. A gap measured at 20 °C before tightening may differ after fastener preload, heating, pressure, or motion. Name the surfaces or derived features that define the response and the direction in which it is measured.
Draw a Closed Dimension Loop
A tolerance stack is a signed loop from one functional boundary to the other. Trace a single path through every dimension that increases or decreases the closing result. If a dimension does not lie on that path, it does not belong in that one-dimensional stack.
Assign a positive sign to dimensions that increase the response and a negative sign to dimensions that reduce it. The nominal assembly result is the algebraic sum:
Y = Σ(sᵢ × xᵢ)
where Y is the assembly response, xᵢ is a contributing dimension, and sᵢ is +1 or −1. Put the loop on a section view so reviewers can see exactly which contacts and datums were assumed.
Use Functional Contact Points, Not Convenient Dimensions
CAD models contain many dimensions that do not determine assembly location. A shoulder seats against a bearing race, a flange contacts a gasket, and a dowel controls lateral position. The loop must follow those real contacts rather than dimensions that are merely easy to find on individual drawings.
Account for gaps and mobility. A bolt in a clearance hole usually does not center two parts. A slip-fit pilot may locate radially but float axially. A spring, seal, or elastomer may establish a force-dependent position. If the contact state can switch, analyze each credible state rather than forcing one linear chain to represent all of them.
Build a Stack Table
Use one row per independent contributor and preserve traceability to the drawing characteristic. A practical table includes nominal value, upper and lower deviation, sign, distribution assumption, process state, and evidence source.
| Contributor | Nominal | Tolerance | Sign | Worst-case contribution | Evidence |
|---|---|---|---|---|---|
| Housing shoulder depth | 25.00 mm | ±0.05 mm | + | ±0.05 mm | Housing drawing balloon 12 |
| Bearing width | 12.00 mm | ±0.02 mm | − | ±0.02 mm | Supplier specification |
| Spacer thickness | 10.00 mm | ±0.03 mm | − | ±0.03 mm | Spacer drawing balloon 4 |
| Cover recess | 3.20 mm | +0.04/−0.00 mm | + | +0.04/−0.00 mm | Cover drawing balloon 8 |
| Gasket compressed thickness | 0.80 mm | ±0.08 mm | + | ±0.08 mm | Qualified compression range |
Do not convert asymmetric limits to a symmetric ± value unless the shift in nominal is carried through the calculation. Store upper and lower deviations separately when necessary.
Worst-Case Arithmetic Guarantees Limit Combinations
Worst-case analysis adds the extreme contribution of every tolerance in the adverse direction. For independent bilateral terms, the total worst-case spread is the sum of their absolute limits. The minimum and maximum result can also be calculated by substituting each dimension’s applicable lower or upper limit according to its sign.
This method protects interchangeability for every allowed combination, assuming the model includes all contributors and each requirement is respected. It is appropriate for safety-critical clearances, hard interference limits, low-volume assemblies without stable process data, and designs where selective assembly or adjustment is not allowed.
Its cost is conservatism. The probability that every component simultaneously reaches its worst adverse limit may be very low, yet the tolerance allocation must permit it. Do not reject worst-case merely because it is conservative; decide whether guaranteed interchangeability is a real requirement.
RSS Estimates Random Independent Variation
Root-sum-square analysis combines independent, centered, approximately normal contributors by taking the square root of the sum of squared standard deviations. When tolerances are expressed as equal ± limits at an assumed sigma level, a simplified RSS of the tolerance widths is sometimes used.
σᵧ = √Σ(aᵢ²σᵢ²)
Here aᵢ is the sensitivity coefficient of the output to each input. In a simple linear signed chain its magnitude is often one. The predicted distribution can then be compared with assembly limits using the selected coverage.
RSS is not a guarantee. It can be misleading when processes are off-center, distributions are bounded or skewed, contributors are correlated, sample data are weak, or inspection screens parts near specification limits.
Monte Carlo Handles Nonlinear and Mixed Distributions
Monte Carlo analysis samples defined input distributions and runs the assembly model many times. It is useful for nonlinear geometry, trigonometric effects, contact changes, asymmetric tolerances, clearance-dependent shifts, and mixtures of measured supplier data.
The credibility of the result depends on the inputs. A million simulated assemblies do not compensate for invented standard deviations or ignored correlation. Record each distribution, source, truncation rule, correlation, sample size, and version of the model. Compare simulated tails with physical builds before using the result to relax drawings.
Choose the Analysis Method from the Decision
| Decision context | Preferred starting method | Why |
|---|---|---|
| Hard no-interference boundary | Worst case | Protects all permitted limit combinations |
| Prototype with little process data | Worst case plus sensitivity study | Avoids unsupported probability assumptions |
| Stable high-volume production | Statistical/RSS with capability evidence | Can allocate tolerances economically |
| Nonlinear linkage or angular stack | Monte Carlo or kinematic model | Captures sensitivities that change with position |
| Adjustable or shimmed assembly | Worst case around adjustment range | Verifies the adjustment can absorb variation |
| Selective assembly | Statistical model with controlled bins | Requires measured distributions and logistics controls |
Often the best workflow uses more than one method: establish a physical worst boundary, model expected yield statistically, and test sensitivity to drifting means.
Convert Plus/Minus Dimensions into Functional Coordinates
Baseline dimensions and chained dimensions can obscure which surfaces actually locate the assembly. Reframe dimensions from functional datums. Where appropriate, use basic dimensions and GD&T to control location and orientation instead of a chain of coordinate tolerances.
This does not make variation disappear. It changes how allowable variation is expressed and inspected. The stack must translate geometric tolerance zones into the output direction and include datum feature mobility where the drawing permits it.
Include Geometric Tolerances Correctly
Flatness, parallelism, perpendicularity, position, profile, and runout can move the effective contact or interface. A planar face with parallelism error may contribute different axial offsets depending on where the mating part contacts. Position tolerance on a hole may contribute radial assembly float rather than the full tolerance value in one Cartesian direction.
Do not simply add every feature-control-frame number as a ± linear term. Determine the geometric sensitivity to the assembly output. A diametrical position zone of 0.20 mm does not automatically equal ±0.20 mm in X; the extreme one-axis component is related to the zone radius and the pattern’s actual mobility.
Treat Datum Mobility as an Assembly Mechanism
Clearance between a datum feature and its simulator can allow translation or rotation. In inspection this may appear as datum shift; in assembly it may be actual part movement before fasteners are tightened. The direction and amount available depend on feature size, boundary, contact sequence, and other constraints.
Model mobility only when the physical assembly can use it. If friction, preload, a secondary pilot, or assembly sequence prevents the calculated shift, do not count it as free tolerance. Conversely, ignoring real clearance can make a stack needlessly tight.
Account for Fits and Bearing Internal Clearance
Shaft and bore size determine clearance or interference, but the stack may also depend on contact pressure, insertion force, ring expansion, and bearing internal clearance. A press fit can expand a bearing inner race or contract an outer race, altering operating clearance and preload.
Use the bearing or component manufacturer’s engineering data for purchased parts. Include housing and shaft form, surface finish, material modulus, wall thickness, and temperature. A nominal fit label such as H7/g6 is not a complete prediction of the assembled result.
Include Fasteners Without Assuming They Locate
Bolts normally clamp; dowels, pilots, keys, or fitted fasteners locate. If ordinary bolts pass through clearance holes, parts may shift anywhere within the available clearance before friction holds them. That mobility can dominate connector alignment or edge position.
Model minimum and maximum fastener diameter, hole size, position, pattern rotation, seating, and tightening sequence. If the assembly procedure intentionally biases parts against one side of the clearance, document the fixture and direction. A manual “align by eye” step is not a stable tolerance control.
Model Shims and Adjustment Ranges
Shims can turn a tight manufacturing stack into an adjustable assembly, but their available increments, compression, parallelism, and installation process matter. Confirm that the minimum and maximum unshimmed results fall within the purchasable shim range and that increment size supports the final target.
For threaded adjusters or slotted mounts, include travel, pitch, backlash, locking shift, tool access, and measurement resolution. State whether the drawing permits field adjustment and what evidence records the final setting.
Add Surface Treatments and Adhesive Bond Lines
Anodizing, plating, paint, conversion coatings, adhesive, sealant, and gaskets can add or remove effective thickness. Coating may be masked from locating surfaces, build on one or both sides, or change unevenly around edges and holes. Grinding after heat treatment may reset some dimensions but not others.
Specify the stack state: as-machined, after treatment, after cure, or after compression. Use qualified bond-line or gasket data under the actual clamp pressure and temperature. Do not treat a catalog nominal as a tightly controlled dimension unless the supplier guarantees it.
Add Thermal Expansion
When assembly or operation spans temperature, each path changes according to length, material coefficient, and temperature change. For a simple uniform term:
ΔL = α × L × ΔT
Mixed aluminum, steel, titanium, polymers, ceramics, and composites can shift clearances substantially. Heat sources may create gradients, so a uniform temperature assumption can be inadequate. Analyze cold start, steady state, thermal transients, and any required soak condition for inspection.
Recognize Elastic Deformation and Preload
Fastener preload compresses joints, gaskets, and soft materials and can bend flanges. Bearings, springs, snap rings, wave washers, and seals impose forces that change dimensions. A purely rigid stack can predict a gap that disappears after tightening.
Use stiffness or finite-element analysis when deformation materially affects function. Correlate with torque-tension data, clamp sequence, friction assumptions, and physical measurement. Separate permanent dimensional variation from load-dependent displacement so drawings do not attempt to control an elastic response with an inappropriate machining tolerance.
Include Purchased Components and Supplier Data
Bearings, seals, motors, connectors, fasteners, optical elements, and castings contribute variation. Catalog “typical” values are not guaranteed limits. Obtain the controlled specification, tolerance class, lot variation, and change-notification policy.
For statistical analysis, request actual production distributions rather than assuming a centered normal process. When multiple sources are approved, analyze each source or require interchangeable limits. A supplier change can invalidate an optimized stack even when the part number stays the same.
Prevent Double Counting
The same error can appear in more than one drawing dimension or GD&T callout. Adding size, location, and a derived assembly measurement without mapping dependencies may count one variation twice. Chained dimensions can also share a common datum and therefore be correlated.
Create a dependency diagram and identify independent manufacturing variables. In a statistical model, use covariance or shared variables for correlated contributors. In a worst-case model, verify that combined extremes are physically possible.
Run Sensitivity Analysis Before Tightening Anything
Calculate how much each contributor changes the assembly response. In a linear one-to-one stack, contribution relates directly to tolerance. In angular or levered geometry, a small tolerance far from the pivot can have a large effect.
Rank contributors by worst-case span and statistical variance. Then evaluate design changes: shorten the loop, locate parts from a common datum, add a pilot, move a fastener pattern, introduce adjustment, or control a contact surface. Tightening a low-sensitivity dimension adds cost without solving the dominant problem.
Allocate Tolerance by Process Capability and Function
Once the architecture is sound, assign limits that protect the output and fit realistic processes. A turned bearing journal, ground spacer, milled pocket, stamped shim, and molded seal have different achievable distributions and costs. Discuss feature size, material, aspect ratio, setup, thermal state, and inspection access with suppliers.
Do not use an unqualified “general CNC tolerance” for every contributor. Mark critical characteristics, but keep the list short enough to manage. Where statistical assumptions support the allocation, define the required capability index, sample plan, and reaction rule rather than merely asking the supplier to “hold process capability.”
Use Measurement Uncertainty in the Acceptance Plan
When a component dimension is close to its specification limit, measurement uncertainty affects the risk of false acceptance or rejection. The assembly model may combine data from CMMs, micrometers, functional gages, optical systems, and supplier certificates with different uncertainty.
Set decision rules, resolution, calibration, temperature, fixturing, and sampling appropriate to the tolerance. For statistical distributions, subtracting estimated gage variation from observed variation may be necessary, but only through a validated measurement-system analysis.
Validate the Stack with Physical Builds
Measure actual components and the assembled response across representative units. Preserve serial or lot relationships so inputs can be matched to outcomes. Compare predicted nominal, range, and distribution with results. Investigate systematic offsets instead of adjusting the spreadsheet to make it agree.
Purposefully test boundary conditions when safe: small and large purchased components, shim extremes, temperature limits, and different suppliers. A prototype that assembles once proves possibility, not tolerance robustness.
Control Revisions and Assumptions
The stack is a design record. Give it a document number, owner, revision, unit system, governing drawings, CAD revision, software version, and approval status. Lock formulas and distinguish inputs from calculated cells. Record every distribution, capability value, and correlation source.
When any drawing, supplier, material, coating, assembly sequence, or operating condition changes, assess whether the stack requires revision. A current drawing linked to an obsolete stack is more dangerous than having no model, because it creates false confidence.
A Worked Axial Example
Assume a cover traps a bearing with a target endplay of 0.05 to 0.25 mm. The nominal housing depth is 20.10 mm, bearing width 12.00 mm, spacer 7.90 mm, and compressed gasket 0.05 mm. If the gap is housing depth plus gasket minus bearing and spacer, nominal endplay is 0.25 mm.
Suppose the unilateral or bilateral adverse ranges total +0.14/−0.16 mm. Worst case becomes 0.09 to 0.39 mm, missing both the upper target and leaving little margin at the lower boundary. The correct response is not automatically to tighten all four parts.
Sensitivity shows whether housing depth or gasket variation dominates. Possible changes include moving nominal endplay toward the center, replacing the compressible gasket at the locating path, using a controlled shim, grinding the spacer, or measuring and selecting one component. The team then updates the stack with real process and assembly data.
RFQ Information for Stack-Critical Parts
Send each supplier the 3D model, controlled 2D drawing, part revision, material and condition, quantities, and the assembly-critical characteristics they influence. Explain the functional interface without disclosing unnecessary proprietary system details.
Ask suppliers to identify:
- The process and setup that establish each critical dimension or datum.
- Expected capability based on comparable geometry and material.
- Measurement method, uncertainty, and final inspection state.
- Effects of heat treatment, coating, unclamping, or aging.
- Nonrecurring fixture, gage, and programming costs.
- Reaction plans if the process mean shifts.
- Change controls for machines, tooling, subtiers, and raw material.
Use their answers to refine assumptions before award, not after a failed assembly.
Define the Review Deliverables
A completed stack review should produce more than a calculated minimum and maximum. Keep the annotated loop drawing, contributor table, calculation model, sensitivity ranking, assumptions register, validation data, and approved actions together. Identify which component requirements changed because of the analysis and which risks were accepted without a drawing change.
The summary should distinguish a guaranteed boundary from a predicted yield. If a statistical model estimates nonconforming assemblies, state the target yield, expected screening or adjustment process, and ownership of escaped failures. If a shim or selection process is essential, include its work instruction, inventory range, measurement step, and traceability in the production release.
Reviewers should be able to reproduce the result from controlled inputs. A colored dashboard alone is insufficient if formulas, distributions, or sign conventions are hidden. Have design, manufacturing, quality, assembly, and sourcing approve the same assumptions before purchase orders are placed. That shared record prevents one supplier from optimizing a component around a stack that another team has already changed.
Release Checklist
- Define one measurable assembly output and its operating state.
- Draw the signed loop through actual functional contacts.
- Include component, geometric, thermal, coating, fit, and force effects.
- Separate worst-case guarantees from statistical yield predictions.
- Document distributions, correlations, capability evidence, and uncertainty.
- Model fastener clearance and datum mobility only as physically available.
- Include purchased-part limits and all approved sources.
- Run sensitivity analysis before tightening component tolerances.
- Center the nominal response inside its acceptable range.
- Validate with serialized component and assembly measurements.
- Convert the allocation into controlled drawings and inspection plans.
- Revision-control the model and reassess it after relevant changes.
From Analysis to a Manufacturable Assembly
A strong stack begins with function, follows real contacts, and ends with drawing requirements that suppliers can make and inspect. Worst-case arithmetic protects hard boundaries; statistical methods predict yield only when their process assumptions are supported. GD&T, fits, coatings, temperature, preload, and measurement cannot be bolted on after the spreadsheet is finished.
The best cost reduction usually comes from architecture: shorten the loop, create a functional pilot, remove ambiguous mobility, or add controlled adjustment. Tighten only the contributors that materially improve the response. For support reviewing stack-critical machined parts before quotation, submit the 3D models, controlled drawings, quantities, and acceptance needs through Request a Quote.